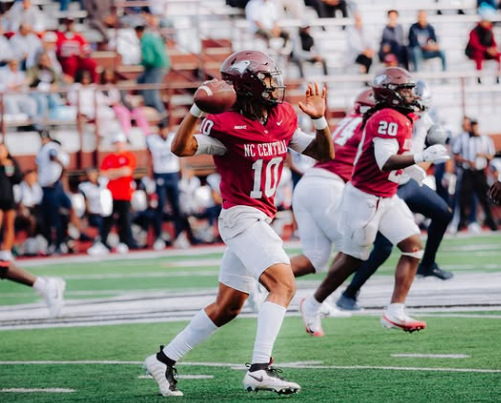


We’ve already taken a side-by-side look at HBCU conference revenues as we examine the facts and figures of HBCU athletics. But let’s try taking a look at a bigger picture. The bigger picture being how the SWAC and MEAC compare to other FCS conferences and not the BCS conferences, as many often make a mistake in doing.
Here are the 2008 revenue rankings for the FCS member conferences.
| Rank | Conference | 2008 Revenues |
| 1. | Mid-Eastern Athletic Conference | $ 5,929,689.00 |
| 2. | Colonial Athletic Association | $ 5,323,989.00 |
| 3. | Southwestern Athletic Conference | $ 4,859,155.00 |
| 4. | Southern Conference | $ 4,589,318.00 |
| 5. | Southland Conference | $ 3,642,511.00 |
| 6. | Big South Conference | $ 3,260,046.00 |
| 7. | Big Sky Conference | $ 3,255,085.00 |
| 8. | Patriot League | $ 2,861,333.00 |
| 9. | Northeast Conference | $ 2,040,563.00 |
| 10. | Colonial Athletic Association Football, Inc. | $ 901,515.00 |
| 11. | Ohio Valley Conference | $ 474,485.00 |
| 12 | Gateway Football Conference | $ 393,347.00 |
| 13. | Great West Conference | $ 38,913.00 |
| Pioneer Football League | No report found | |
| Ivy League | No report found |
Source: Form 990, filed with the Internal Revenue Service.
Updated: (1/15/2010): The Colonial Athletic Association filed a separate Form 990 with the IRS under “Colonial Athletic Association Football Inc.” The report lists gross revenues totaling $901,515.
So what does this all mean? Does it mean that the two FCS HBCU conferences can do no better? Of course not. There are improvements that can be made in many areas. If nothing else, this information should silence some who are quick to jump on the “we need to leave the SWAC (or MEAC)” bandwagon. These numbers prove that things aren’t always as green (pun intended) on the other side as we think.